An innovative project is using TERN satellite data together with on-ground time-lapse cameras and pollen monitors to track grass pollen sources, their evolution, and impact areas. The forecasts generated will help alleviate Australia’s $30B medical and socioeconomic allergy burden and change the lives of millions of Australians for the better.
With blossoms blooming everywhere and footy finals finished, spring is well and truly in the air. Many rejoice at the warmer weather, but Professor Alfredo Huete and the millions of allergy sufferers around Australia, are reaching for the tissues as the nation’s peak hayfever season takes hold.
Ironically, but very reassuringly, Alfredo leads the Ecosystem Dynamics Health and Resilience research program at the University of Technology Sydney, which is developing innovative methods to map and forecast pollen exposure in Australia.
“I guess if you suffer from something you naturally develop a desire to know more about it and help reduce its impact,” says Alfredo.
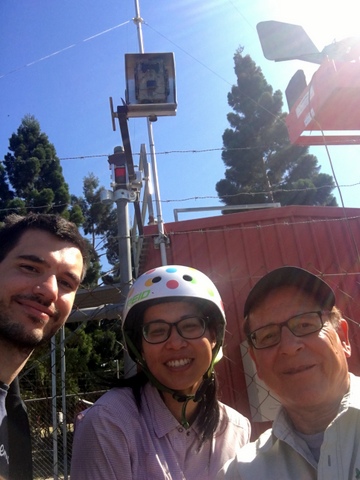
Alfredo is investigating the causes of recent increases in pollen allergen exposure through an innovative ARC Discovery project that integrates satellite data with on-ground time-lapse cameras and pollen monitors to track grass pollen sources, their evolution, and impact areas.
The team, which includes Professor Janet Davies of Queensland University of Technology and Associate Professor Paul Beggs of Macquarie University, uses TERN satellite data on the changes to the ‘greenness’ of Australia’s vegetation to get an indication of grass growth and from that infer the level of grass pollen in the air.
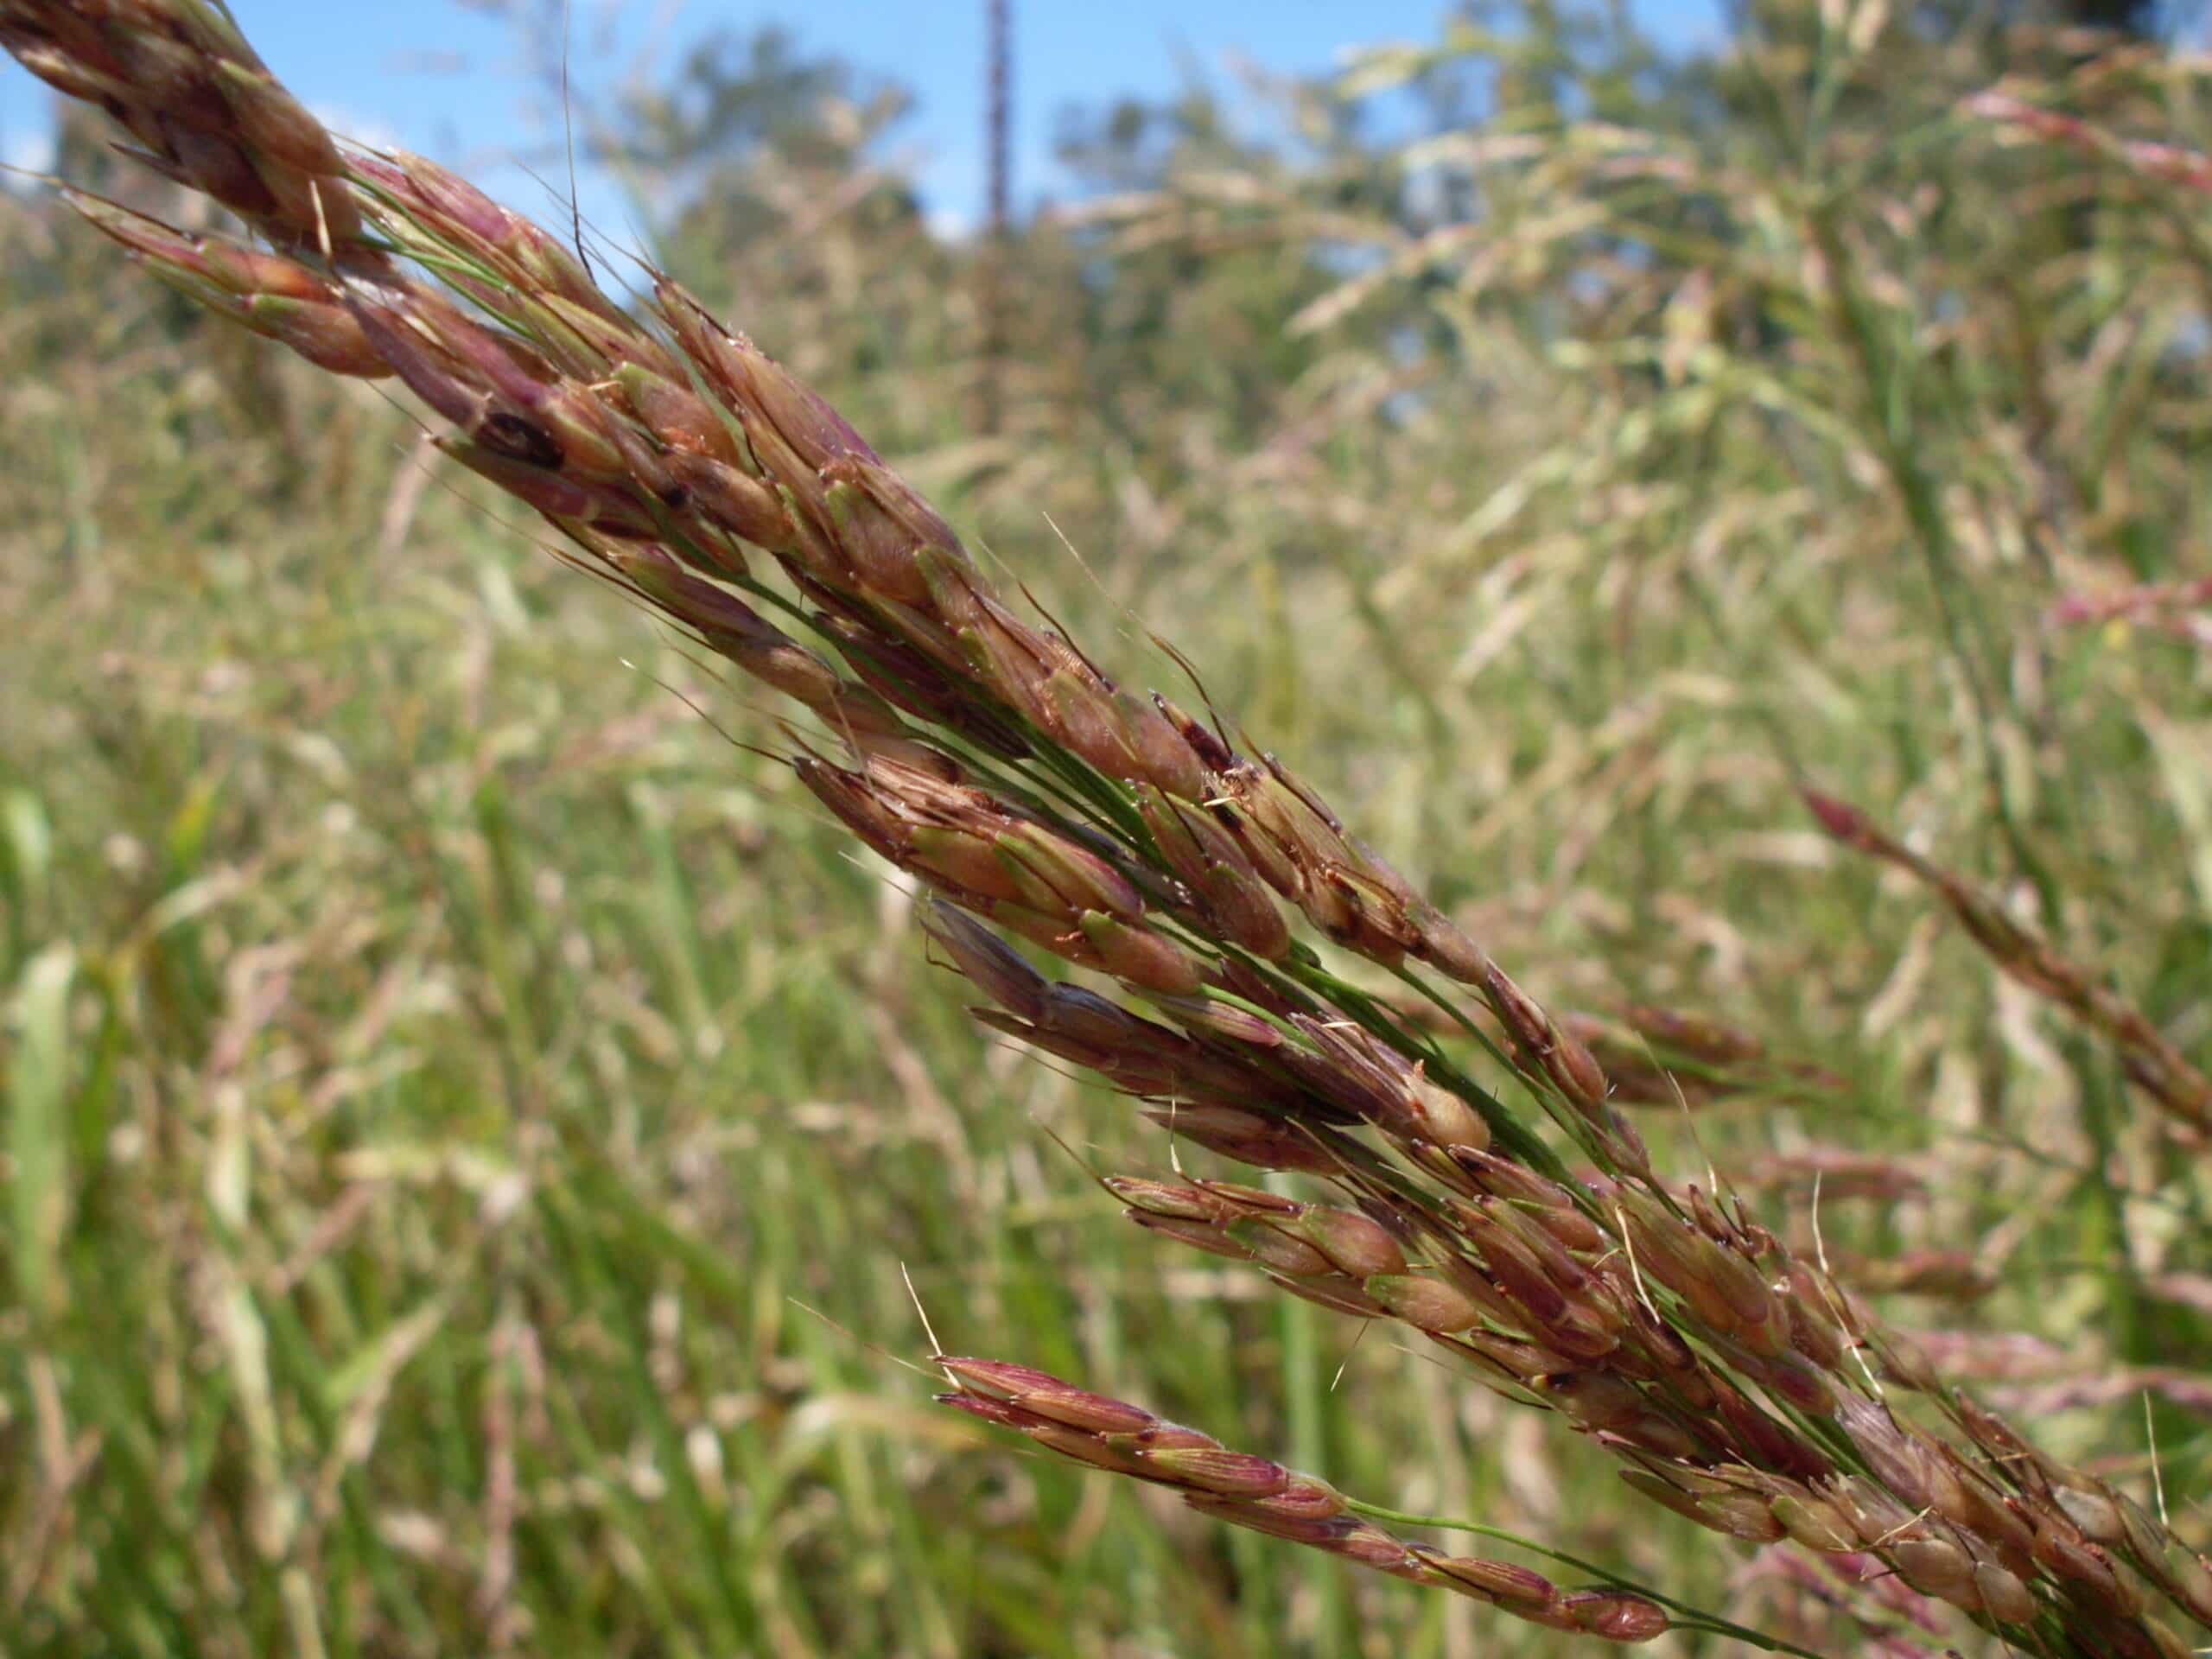
This information is compared with on-the-ground data from AusPollen pollen-monitoring stations in capital cities and grass flowering images captured by phenology monitoring cameras (or phenocams) installed throughout grass growing regions from Victoria to Queensland.
“If the data we collect at the pollen monitors and phenocams match the satellite data, we can accurately scale up the information outward to cover an entire city, region or the whole nation,” says Alfredo.
“We can tell, for example, where grass pollen levels are highest and the timing of their changes because the TERN satellite data keeps track of various properties about the vegetation and how it changes.”
“We are also successfully mapping and monitoring the two distinct warm and cool season grasses, known as C3 and C4, which are responsible for the different timings of allergy seasons in the capital cities. Using DNA metabarcoding to track regional and season changes in airborne pollen samples collected at multiple study sites, Professor Davies’s laboratory at QUT will be able to confirm the distribution of the C3 and C4 grasses.”

Forecasting pollen exposure and movement for early warning
TERN’s ‘greenness’ datasets, together with a suite of other land cover dynamics and phenology datasets, characterise the changes in vegetation cover due to seasonal or long-term influences.
By combining these remotely sensed data with meteorological parameters such as wind direction and rainfall, scientists can predict when and where grass pollen levels are going to be high.
Alfredo’s pollen forecasting work also uses soil moisture data collected by NASA’s SMAP satellite and calibrated and validated by the eddy covariance data collected by TERN’s landscape research sites.
“We’re using the NASA SMAP soil moisture data to predict grass production (or productivity, or biomass) and when grasses are going to start flowering,” says Alfredo. “If we know, for example, that a grassland has good soil moisture levels then, which creates more grass growth and flower development, we can generally predict that pollen production from that area will be high, and vice versa.”
“But the interesting aspect in having knowledge of soil moisture is that we can adjust and refine our forecasts of grass production, flowering and pollen, especially when we encounter plant stress from low soil moisture periods.”
“Due to the large number of variables that affect pollen production and transport, there’s quite a lot of uncertainty involved in forecasting. But, we’re making progress and more sophisticated ecological forecasts aren’t far away.”
More accurate pollen forecasts will help alleviate the medical and socioeconomic burden costs of allergic diseases, which are estimated at $30 billion.
It’s likely that they will also form an integral part of the National Environmental Prediction System (NEPS), which will underpin strategic decisions for the management of our entire continent and surrounding oceans.
Put simply, accurate pollen forecasting is the wind of change set to improve the lives of millions of Australians.
- Professors Huete’s lab group and collaborators including Associate Professor Paul Beggs presented their research at the TERN-supported Phenology 2018 Conference in Melbourne in September. These presentations are available below or via TERN’s SlideShare page.
- ABC Catalyst will showcase this research in a forthcoming episode to be aired in 2019. Follow TERN on Twitter and keep an eye on the TERN website for announcements.
- For more information on TERN’s open access land cover dynamics and phenology datasets click here.


