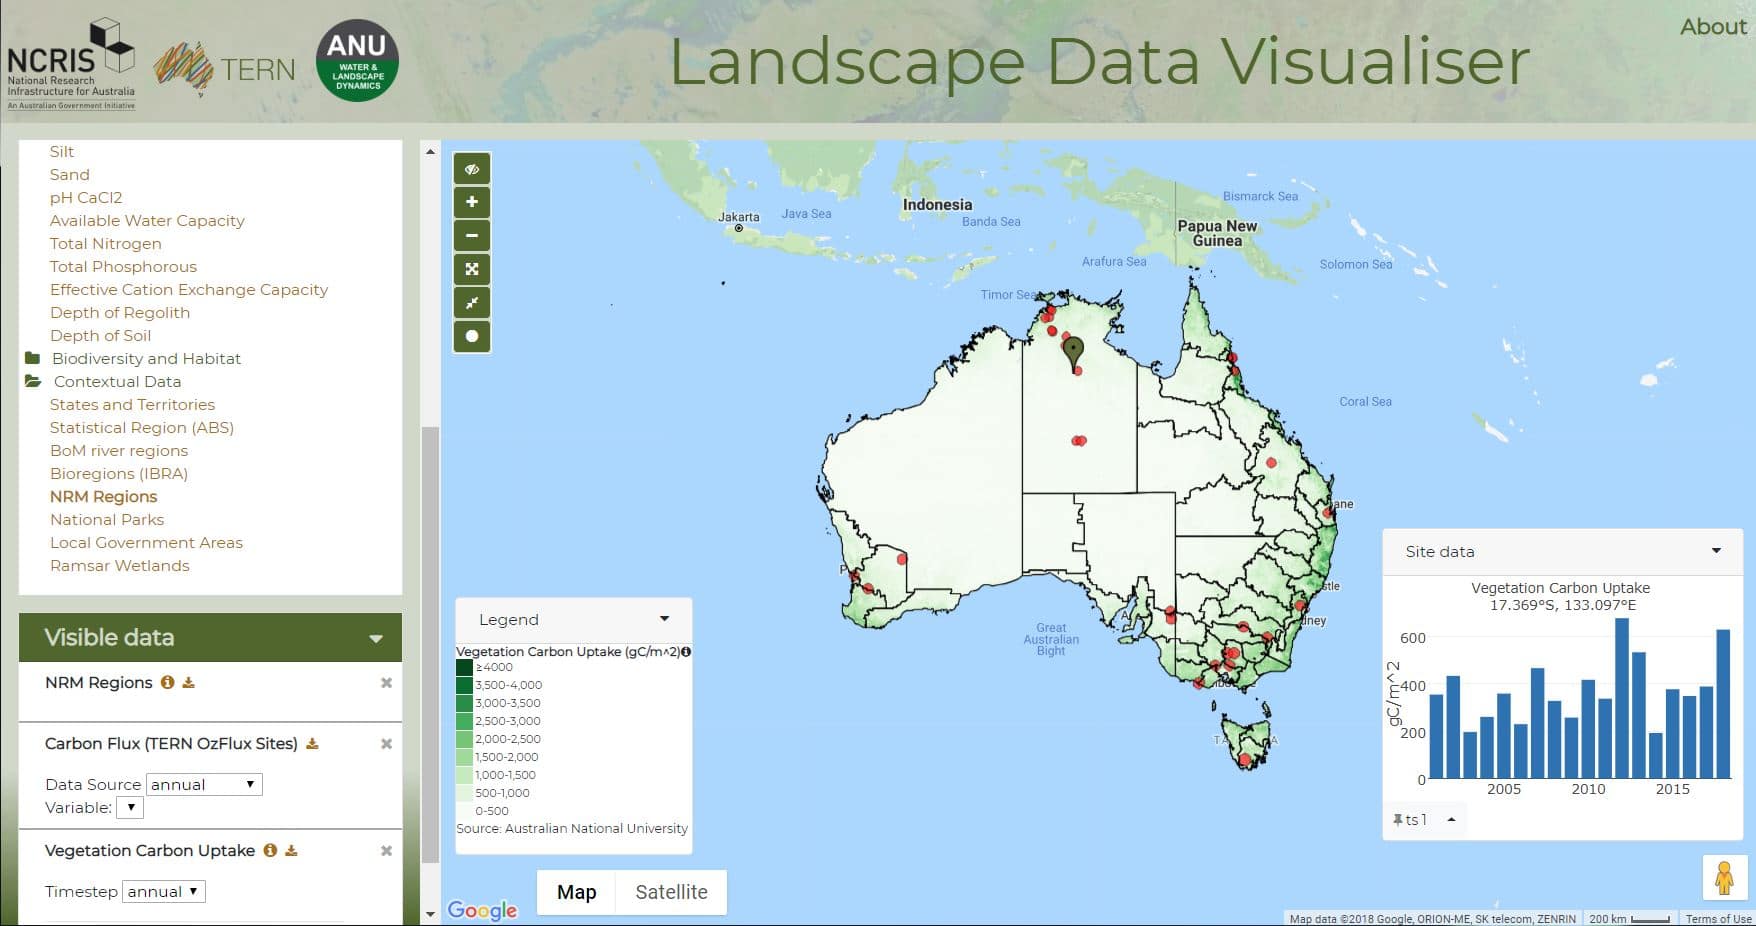
Discover, map and analyse the variety of landscape and ecosystem data provided by TERN and ANU’s Centre for Water and Landscape Dynamics, including satellite observations, national-scale predictions, airborne measurements, and sensor network and survey data. Read on for easy online access to over 50 datasets and useful visualisations.
The sheer abundance of data on Australia’s natural environment means that the data cannot be easily explored and analysed by non-expert users
To change this, TERN has teamed up with the Australian National University’s Centre for Water and Landscape Dynamics (ANU WALD) to create the TERN-ANU Landscape Data Visualiser.
This new web atlas lets you discover a wealth of landscape and ecosystem data from satellite observations, airborne measurements, field surveys, sensor networks and national-scale model predictions.
The Landscape Research – Data Visualiser gives you access to more than 50 datasets providing information on, for example:
- Ecosystem composition
- Vegetation properties
- Carbon uptake and release
- Bushfires
- Water and energy exchange
- Soil moisture
- Soil depth, texture and chemistry
- River flows and inundation
You can you drill down to any location of interest, compare data and locations, and download any of the data shown
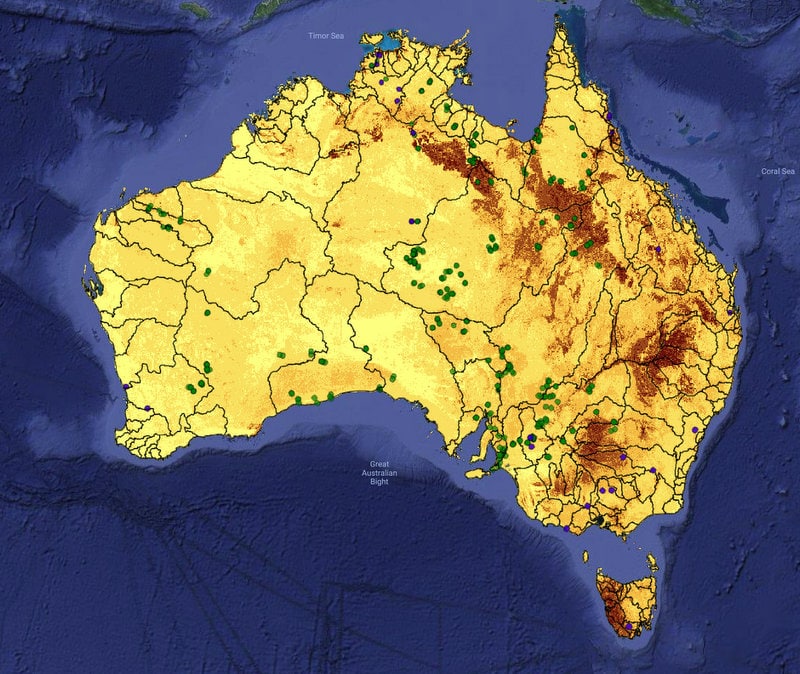
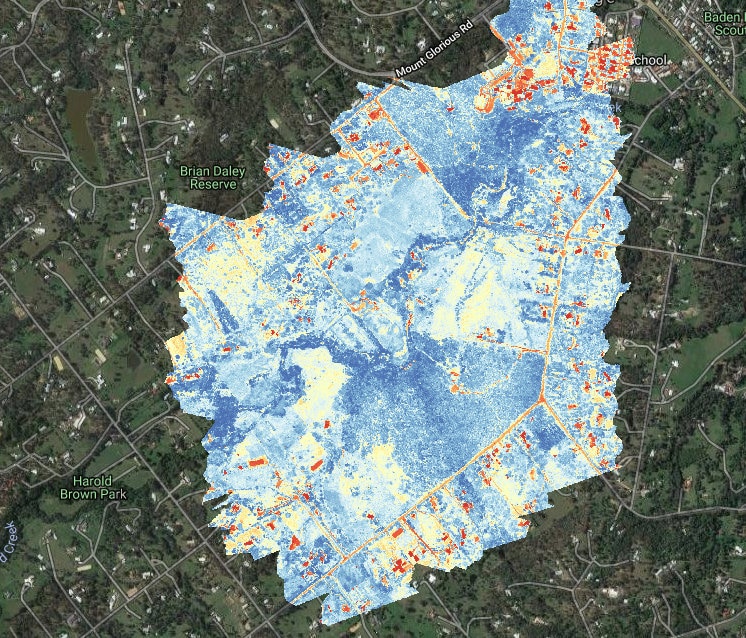
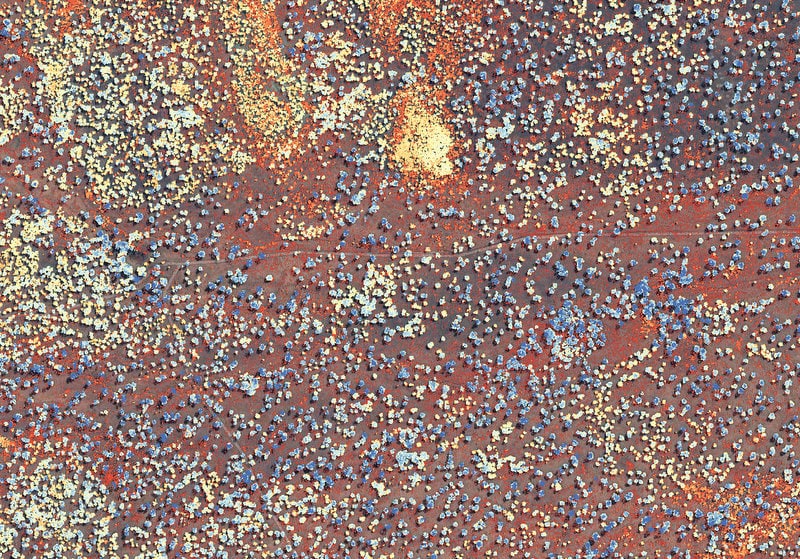
Prof Albert van Dijk, director of ANU WALD, says that the Landscape Data Visualiser lets researchers compare satellite and model-derived data with measurements from TERN’s ecosystem observing field sites and with airborne laser scanning (LiDAR) and hyperspectral data products that TERN has developed for several intensive research locations in Australia.
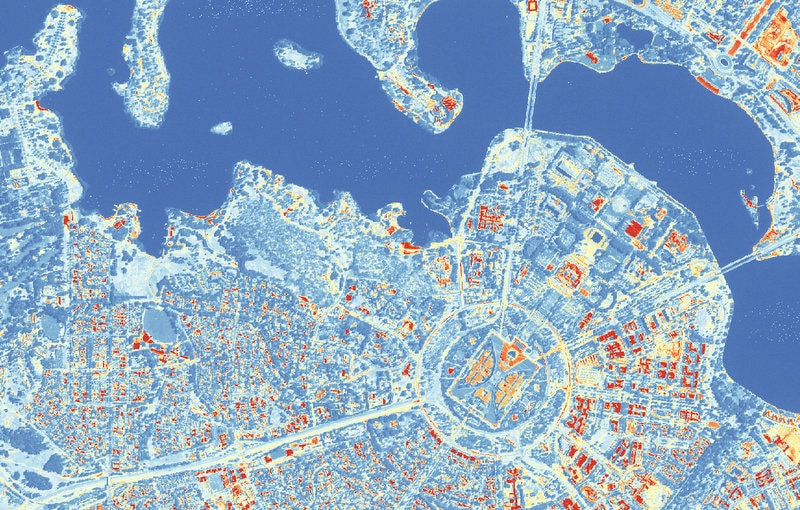
“It also contains many entirely new environmental mapping products that ANU WALD has developed from airborne LiDAR and hyperspectral imaging data collected with support from TERN. This includes airborne campaigns at various TERN SuperSites, but also data covering the entire Australian Capital Territory, for example,” says Albert.
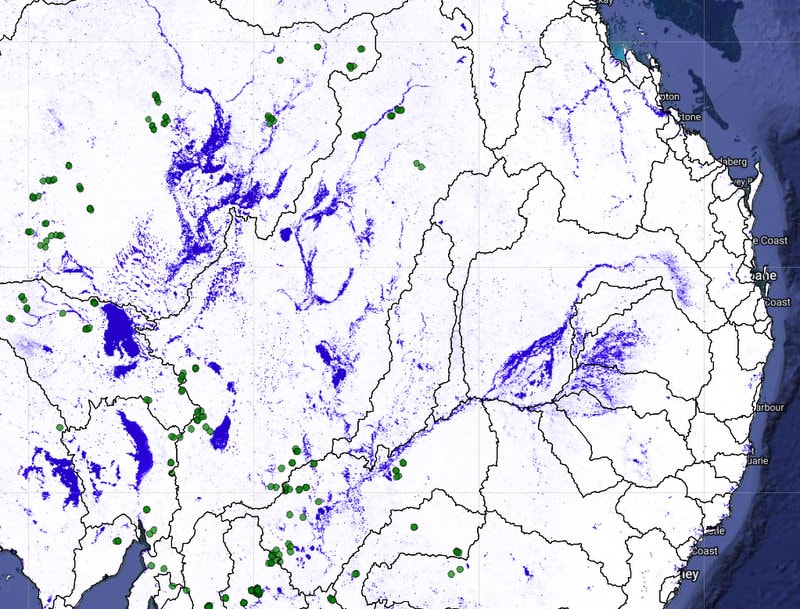
Users can find airborne products relating to vegetation cover, height, structure, foliage chemistry and also digital elevation models, water body mapping and building footprints, to name a few.
Dr Siddeswara Guru, the lead of TERN’s Data Services and Analytics platform, says that the visualiser complements platforms such as Australia’s NationalMap. “It provides a more extensive range of data visualisation and analysis tools, and addresses the specific data and visualisation needs of researchers and government agencies involved in land and water management, farming, conservation and multiple other aspects of environmental management,” says Guru.
“It also allows users to quickly view and manipulate the data without having to download them first, which saves valuable time and computing resources.”
TERN and ANU invite you to test our new Landscape Data Visualiser and provide feedback on its tools and data and how they can be improved further.
- To start your discovery, you can access the Landscape Data Visualiser via TERN (maps.tern.org.au) or via ANU (anuwald.science/ternanu), or click on the image below.
